Mind Maps
When starting a project, I often use a mind map to get a better understanding of what we are trying to do. I write the main idea in the center, for instance it might be ‘Build a new data-center’. Then I draw arrows from the main idea to build relationships. For instance I might draw an arrow to another circle that says “Pick city for datacenter”. Another relationship might be to a task such as “Get Quotes from Vendors”. This helps me figure out from a high level some of the things that I need to do.
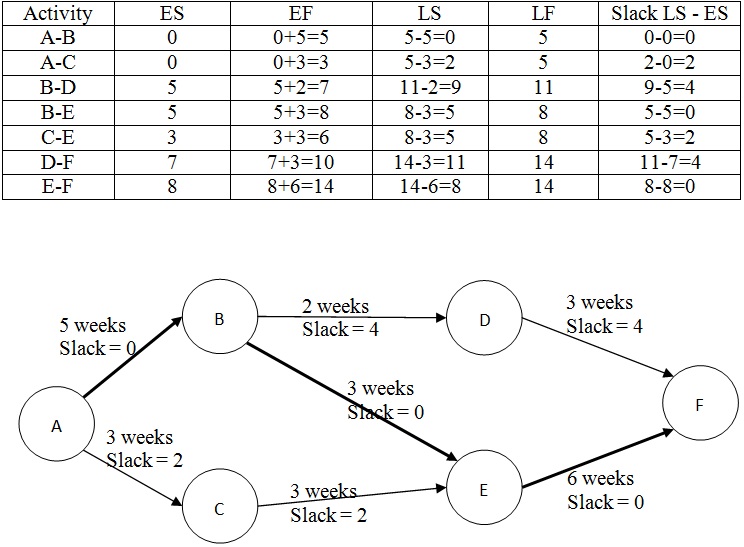
Pert Chart (Network Diagram)
Following a mind map, I then draw a Per chart, also known as a project network diagram. This is used to figure out what the critical path is. I list the various milestones in square boxes, with directed arrows showing the activities that come before and after. The arrows have numbers that indicate the duration of the activity. Critical path is list of activities with the longest duration that must be accomplished for the project to complete.
Gantt
The next chart I often use is the Gantt chart. This type of chart may be generated from a WBS or Work Breakdown Structure, however it may be easier to skip the WBS and go straight for the Gantt chart. Gantt chart lists all the activities in the project, who is responsible for them, start date and end date. A must have tool to figure out what is going on in a project.

Probability and Impact Matrix
In any given project there are risks to the project. The probability and impact matrix lists the risks and their impact on the project. Impact of 10 would be the highest and probability of 10 would be the highest. So a risk that has a probability of 10 and an impact of 10 can cause serious damage to the project unless it is addressed.

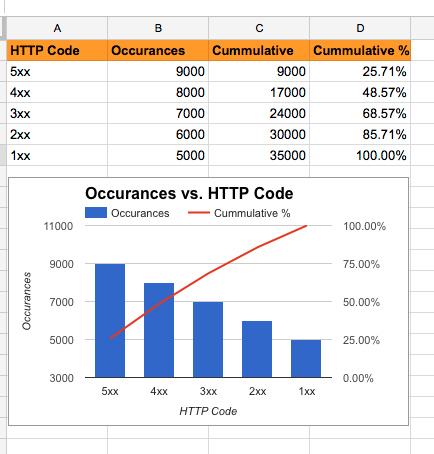
Pareto
During a project, when you encounter different problems and want to figure out which ones to focus on, use a Pareto chart. For instance if you are running a web server and you are trying to figure out the HTTP codes that are commonly occurring, use a Pareto chart. This will help to identify the problem areas.